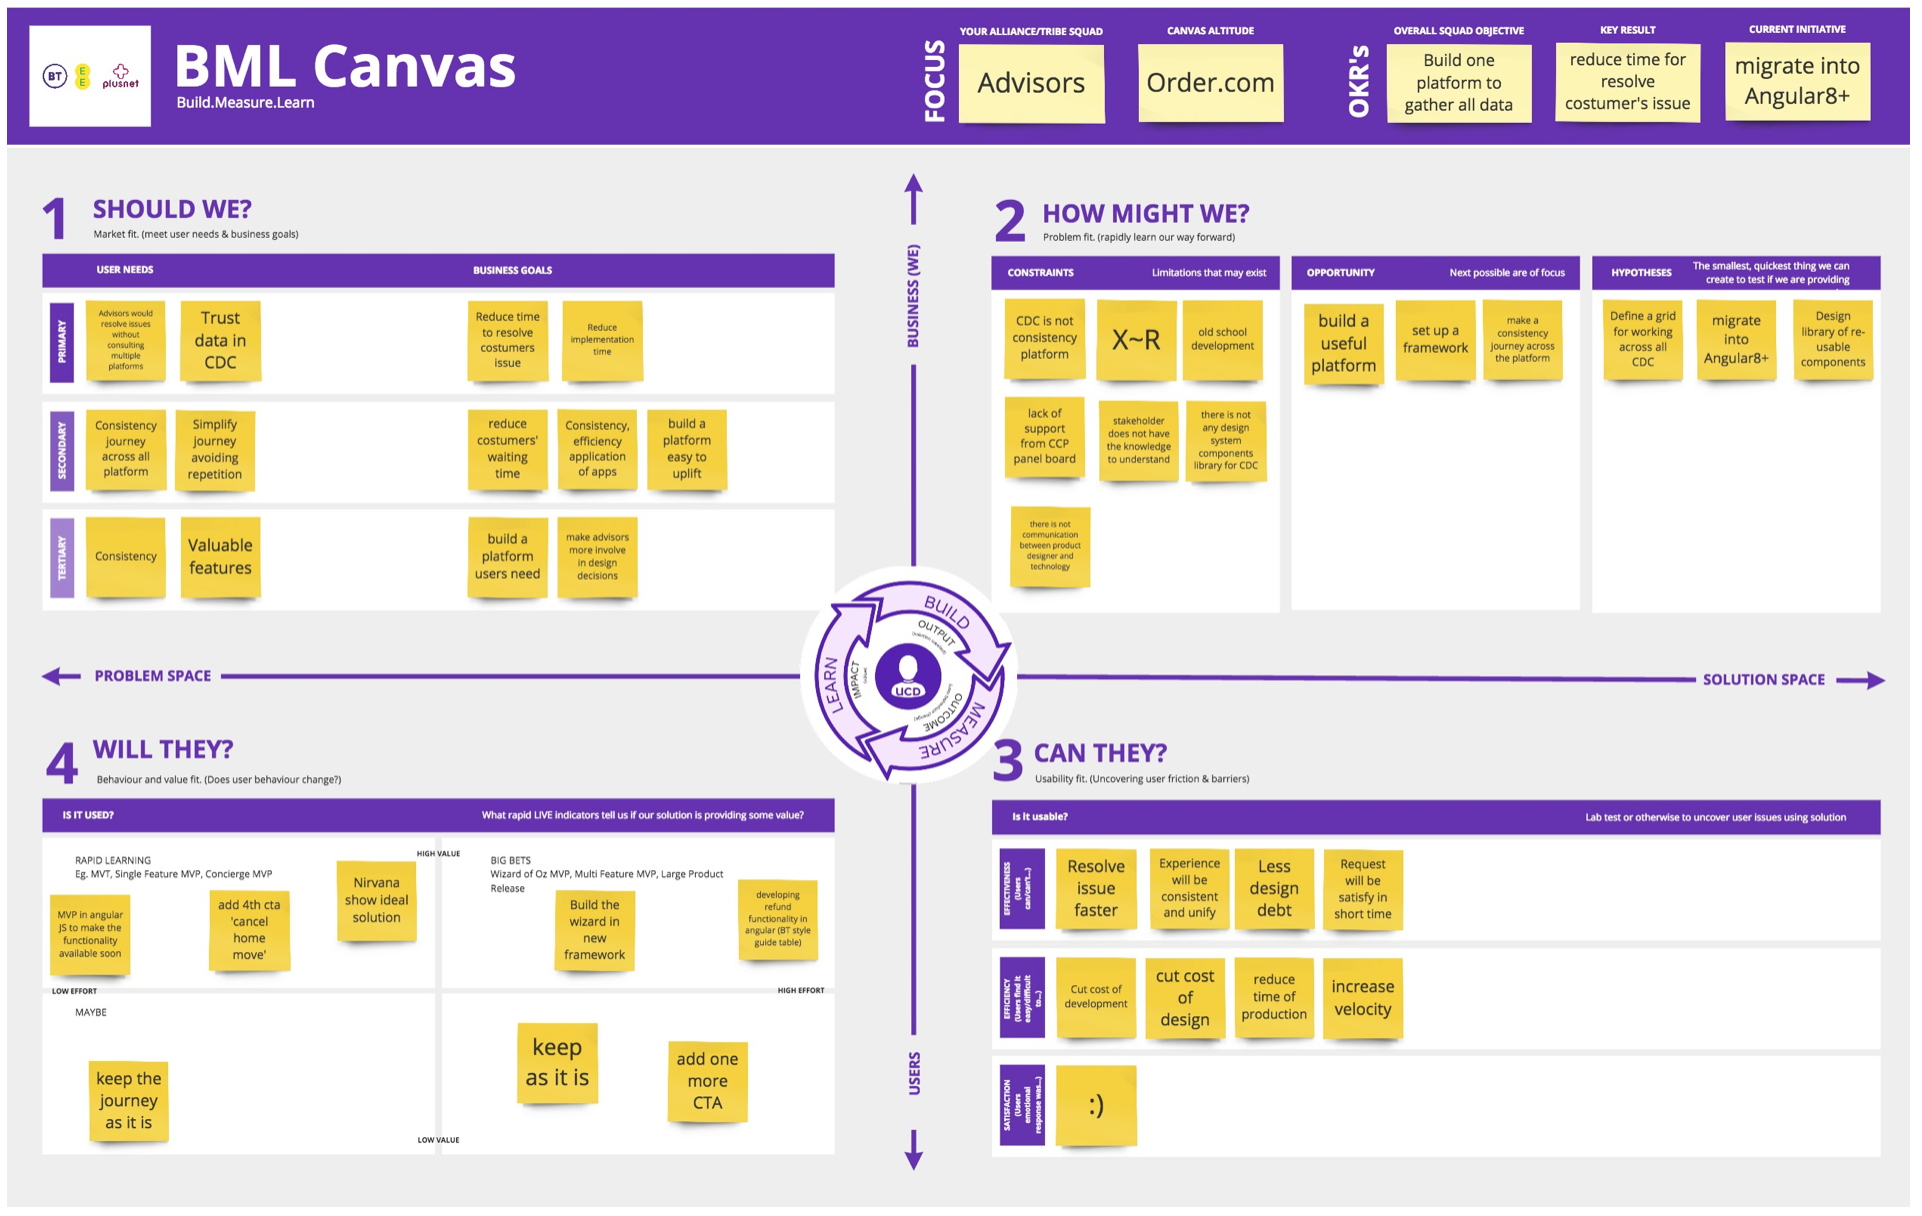
BML - Build Measure Learn Canvas
The use of BML Canvas helps to outlining the issue and understand opportunities, based on users and business needs. It also helps to track all the process . BML canvas need to be use all over the validation process according to the formula of hypotheses and re-engineering.
• The Approach
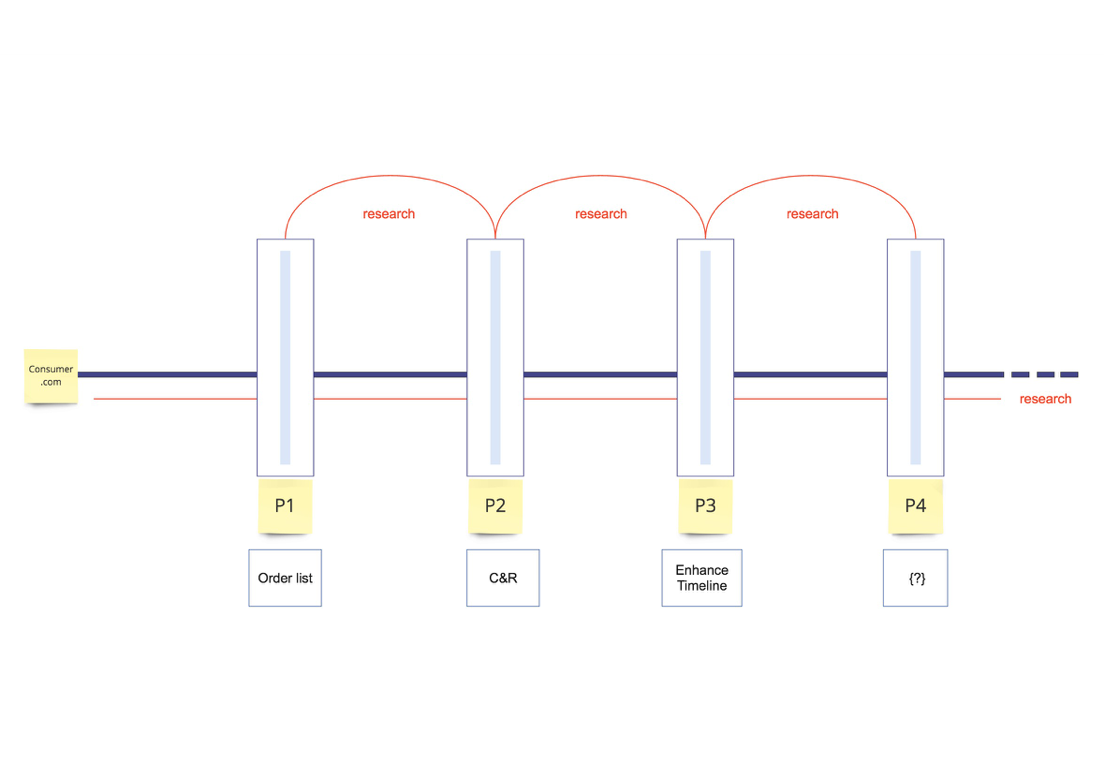
Being the consumer.com a service application of apps I have started to interpreted its design system as a constellation of severals different things linked together by defining common rules, interactions and experiences. For its complexity I have divided the measurement process in two part:
• Vertical measure on single project: P1,P2,P3,…
• Horizontal measure all across the platform
This will help to validate the design system both at local, project by project and at global level
Design system Journey
How to measure a design system?
Internally:
•Consistency
•Design Debt
and compare Savings, Velocity, Simplicity
Externally:
•Advisors’s experience on resolve issue
•Designers and developers re-engineering a task
•Employees on-boarding and re-learning and compare Savings, Velocity, Simplicity to delivery or resolve an issue

The chart help to understand the level of completeness and efficiency of a design system and how to increase the values
Audit research
This chart helps to understand what is necessary validate and the impact of the design system across designers, developers, agents, business and costumers.
Input (Design initiative):
•reduce time of production, development and implementation •build a consistency experience and interaction
•reduce design and tech debt
Output (Business - Costumers benefits):
•cut the cost of production, development and implementation •increase velocity all across the service (from design to costumers’ urgency) reduce costumer’s waiting time •improve the performance

As a Product designer I would…
…make everything simple and intuitive
How:
Measure the velocity
•Compare time of production
•Compare time of development
Technique: Observation, Questionnaire
Main Tools: Paper & Pen, Stopwatch, Spreadsheet
Measure the efficiency
•efficiency on re-usability
•efficiency across the Tribe/Squads
•compare time of new joiners’ on-boarding process •compare time of advisors’s re-learning
Technique: Observation, Questionnaire, Main Tools: Paper & Pen, Stopwatch, Spreadsheet
Measure the consistency
•Design and Technology debt calculation
•SEO analyses
Technique: Debt calculation, Compare the components, Main Tools: Spreadsheet, Tables, Maths, Prioritisation chart

How to calculate the design debt and improve consistency
Adopt and apply a scientific approach to design
1. Define most important elements on the system
2. Count number of variant:
•How many variant of a single element exist within the digital product?
•How many time does each variant show up? Design debt math formula S=(V-1)x(I x 2) S=Score V=Variant I=Instance
Record all the result into a spreadsheet and evaluate the consistency according to the variant spect below:
3.1 Variant Spect
• X4 Variant = 50% Consistency
•X>6 Variant = 0% Consistency SEO crowning tool will count actual number of pages 3.1 UX debt prioritisation
•Describe issue from user’s standpoint, How is it accepting them?
•Where in the experience it occur?
•Frequency of occurrence How often does it happen?
•Who reported the issue?
•Define level of UX and development, effort needed to fix the issue (Low-Medium, High) {Low value low effort}: {High value low effort}: {Low value high effort}: {High value high effort}
3.2 Create a Kamban Board and organising sprint in based of users and business need
4. Build design component library file including way of work, system ingredients components. Designers and developers have to maintain and update. Figma in this case is the tool use to store and track all the components and easily hand over to developers or make a DEMO presentation to the rest of the business.
5. Update

example